|
|
|||||
|
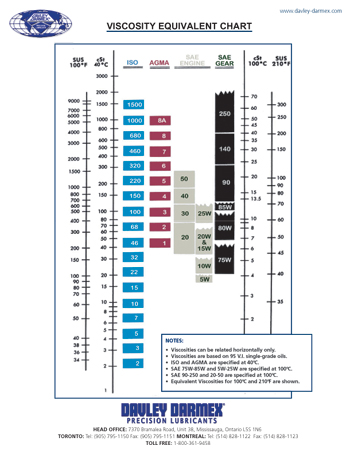
Viscosity Equivalency Chart
Viscosity, or the measure of a fluid's resistance to
flow, is a common method used to classify oil and is
generally measured by passing a standard quantity of
fluid through a standard opening at a specified
temperature. The more viscous the fluid, the more
resistant it is to flow and therefore the longer it will
take to pass through the opening.
Download the Chart The chart is available in PDF and JPG formats. Please right click the file name and select "Save Target As." A copy will save to your destination of choice. Alternatively, double click the file name and a new window will appear. The file will download and open automatically. You will be able to save it once it opens.
|
Need Acrobat Reader?
Acrobat Reader is a free download from the Adobe website.
Click here to get it.
|
||||
|
____________________ |
|||||
|
© Davley Darmex Precision Lubricants, 2025 Davley Darmex Precision
Lubricants, 930 Westport Crescent, Mississauga, ON L5T 1G1 |
|||||